
Visualization types
Choropleth Map
A choropleth map is a type of map in which geographic areas are assigned a color in relation to a data variable.
Choropleth maps are best used to display the geographic distribution of data. You can also use a choropleth map to make comparisons between geographic areas, but be aware that any geographic patterns will depend on the method used to group your data. The data in a choropleth map can be categorical or numeric.
Examples
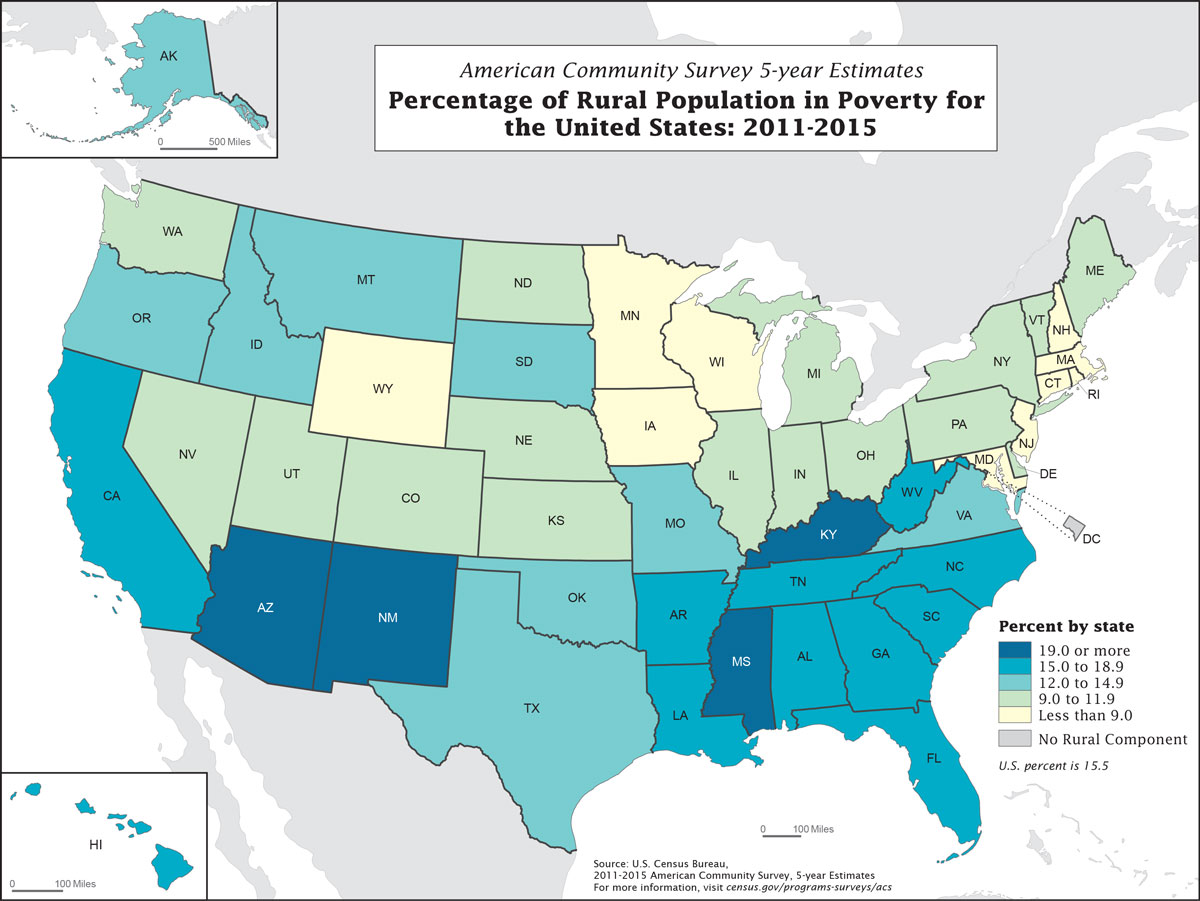
Static Choropleth Map of the United States
Guidance
In addition to the guidance provided in this section, relevant guidance can also be found in the Agency Logo, Colors, Grids, Labels, Legends, Source, Titles, Typography sections.
Requirements
Always
-
Include a legend.
-
Choose an appropriate method of grouping your data if it is numeric.
- The Natural Breaks classification method groups data based on gaps in the data.
- The Equal Interval method divides the data range into equal intervals. This method works best when data are evently distributed. If the distribution is uneven, the predominant values will dominate the map.
- The Quantile method partitions the data so that every group has an equal number or nearly equal number of values. This can give a choropleth map an even, aesthetically pleasing color distribution.
- Subject matter expertise can be used to place data into groups.
Never
-
Never enlarge or highlight D.C. when it is treated as a county equivalent, unless the map’s focus is specifically related to D.C.
-
Never use a qualitative or categorical color scheme to map numeric data.
Recommendations
Recommended
-
Limit the number of categories to five or fewer.
- Fewer categories on a map helps users to better understand what is being visualized and allows for trends in the data to be more easily identified.
-
A national average or median for comparison be placed close to the map’s legend if used.
-
Use an Albers equal-area projection when creating a map of the United States, including insets of Alaska, Hawaii, and Puerto Rico, if applicable.
Not Recommended
-
Don’t use dots, lines, or hatching patterns in a choropleth map.