
Visualization types
Treemap
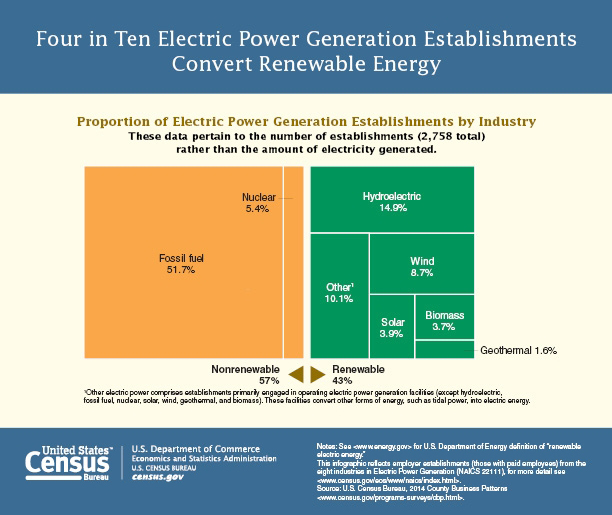
A treemap is a visualization that displays hierarchical data as different groups of nested rectangles.
A treemap gets its name from a tree diagram which is also used to display hierarchical data. The key difference with a treemap is that the size of each rectangle represents the value of each category of data, making it possible to convey more information about each category of data in a smaller space.
Treemaps can be used to represent data that has a tree-like hierarchical relationship, such as age distribution within different groups of people or categories of exports in a country’s economy.
Examples
Static Treemap
Guidance
In addition to the guidance provided in this section, relevant guidance can also be found in the Agency Logo, Colors, Grids, Labels, Legends, Source, Titles, Typography sections.
Requirements
Always
-
Use adjacent colors with varying contrasts.
-
Ensure that any text displayed in each rectangle has a sufficient contrast ratio.
Recommendations
Recommended
-
Keep a straight edge on each side of the diagram.
Not Recommended
-
Don’t include patterns or images in each rectangle.