
Visualization types
Proportional Symbol Map
A proportional symbol map is a type of map that includes symbols that change in size based on the value they represent.
Proportional symbol maps are typically used to show counts or totals and can be used to visualize classed or unclassed data. When using classed data, the map becomes a type of proportional symbol map called a graduated symbol map. The difference between these two types of maps is that graduated symbol maps use range grading, whereas proportional symbol maps use absolute scale or apparent magnitude scaling.
Examples
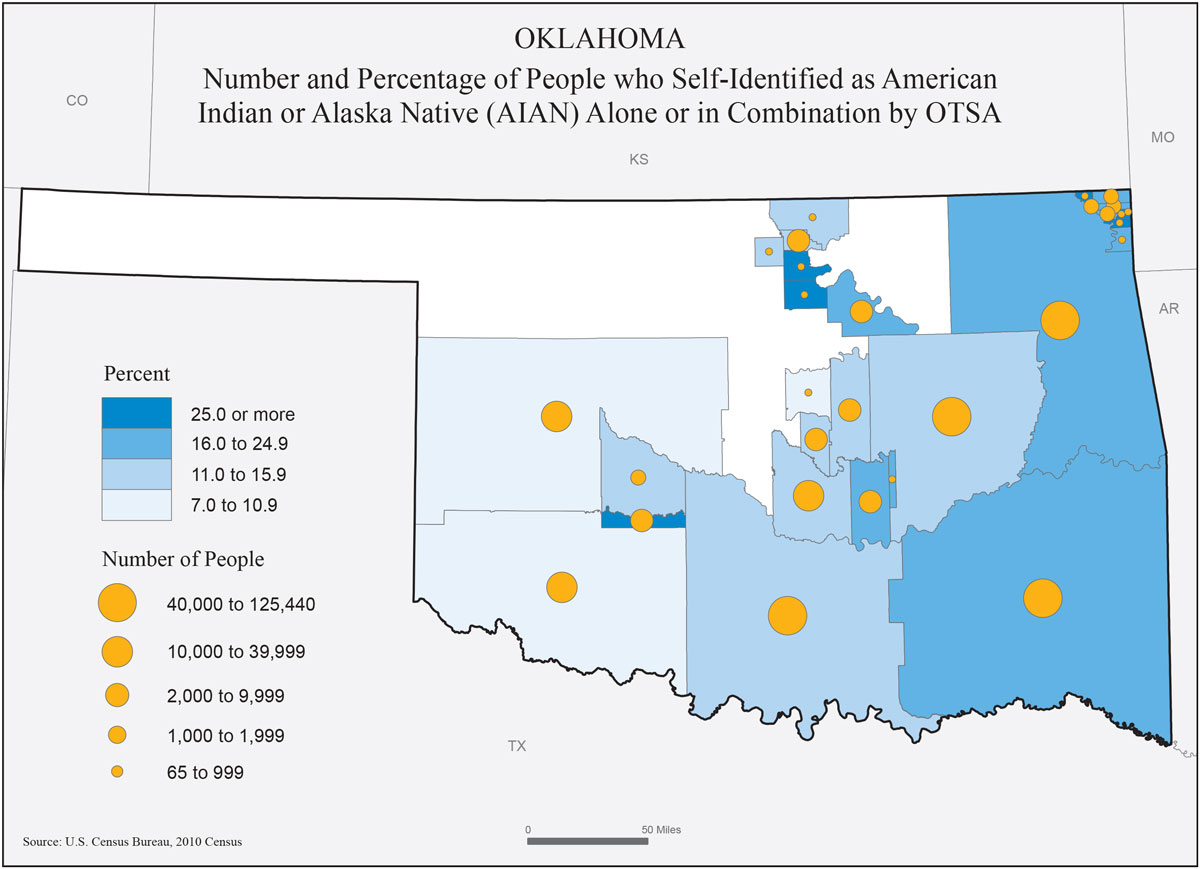
Static Proportional Symbol Map of Oklahoma
Guidance
In addition to the guidance provided in this section, relevant guidance can also be found in the Agency Logo, Colors, Grids, Labels, Legends, Source, Titles, Typography sections.
Requirements
Always
-
Include a legend.
-
Choose an appropriate symbol for your map.
- Consider the relative size of all symbols. If the symbols overlap, is the map still legible?
- Consider the orientation of the symbol. If the symbol is not a circle, ensure the symbol is oriented properly.
-
Choose a method for grouping your data carefully when using a graduated symbol map.
- The Natural Breaks classification method groups data based on gaps in the data.
- The Equal Interval method divides the data range into equal intervals. This method works best when data are evently distributed. If the distribution is uneven, the predominant values will dominate the map.
- The Quantile method partitions the data so that every group has an equal number or nearly equal number of values. This can give a choropleth map an even, aesthetically pleasing color distribution.
- Subject matter expertise can be used to place data into groups.
Recommendations
Recommended
-
Limit the number of classes to five or fewer categories.
- Fewer symbols on the map are more easily distinguished by the eye and will make trends in the data easier to see.
-
Use an Albers equal-area projection, including insets of Alaska, Hawaii, and Puerto Rico, if applicable.
Not Recommended
-
Don’t have symbols on the map overlap. This can sometimes be appropriate depending on the type of symbol and scale of the map.